The Brief
The client needed a credible, visual proof of concept for a space domain awareness platform — something concrete enough to drive discovery conversations with stakeholders and potential partners. There was no existing product to iterate on, no design system, no codebase.
The ask: show what the platform could look and feel like — orbital tracking, conjunction risk assessment, mission planning — quickly enough to matter for an upcoming client presentation.
Research & Design Direction
Before touching any design tool, I spent time understanding the domain. That meant researching existing SDA platforms, orbital mechanics visualization libraries, and the competitive landscape — from commercial players to government-grade interfaces. I needed to know what operators actually use, and where the visual and functional bar sits in this space.
Two things became clear: most existing tools are either visually dated government software or overly simplified commercial dashboards. Neither felt credible for a senior stakeholder presentation.The opportunity was to sit between them — technically dense enough to feel real, polished enough to inspire confidence.
Key Design Decisions
The interface needed to communicate operational seriousness without overwhelming a non-technical audience. I made three decisions early that shaped everything else:
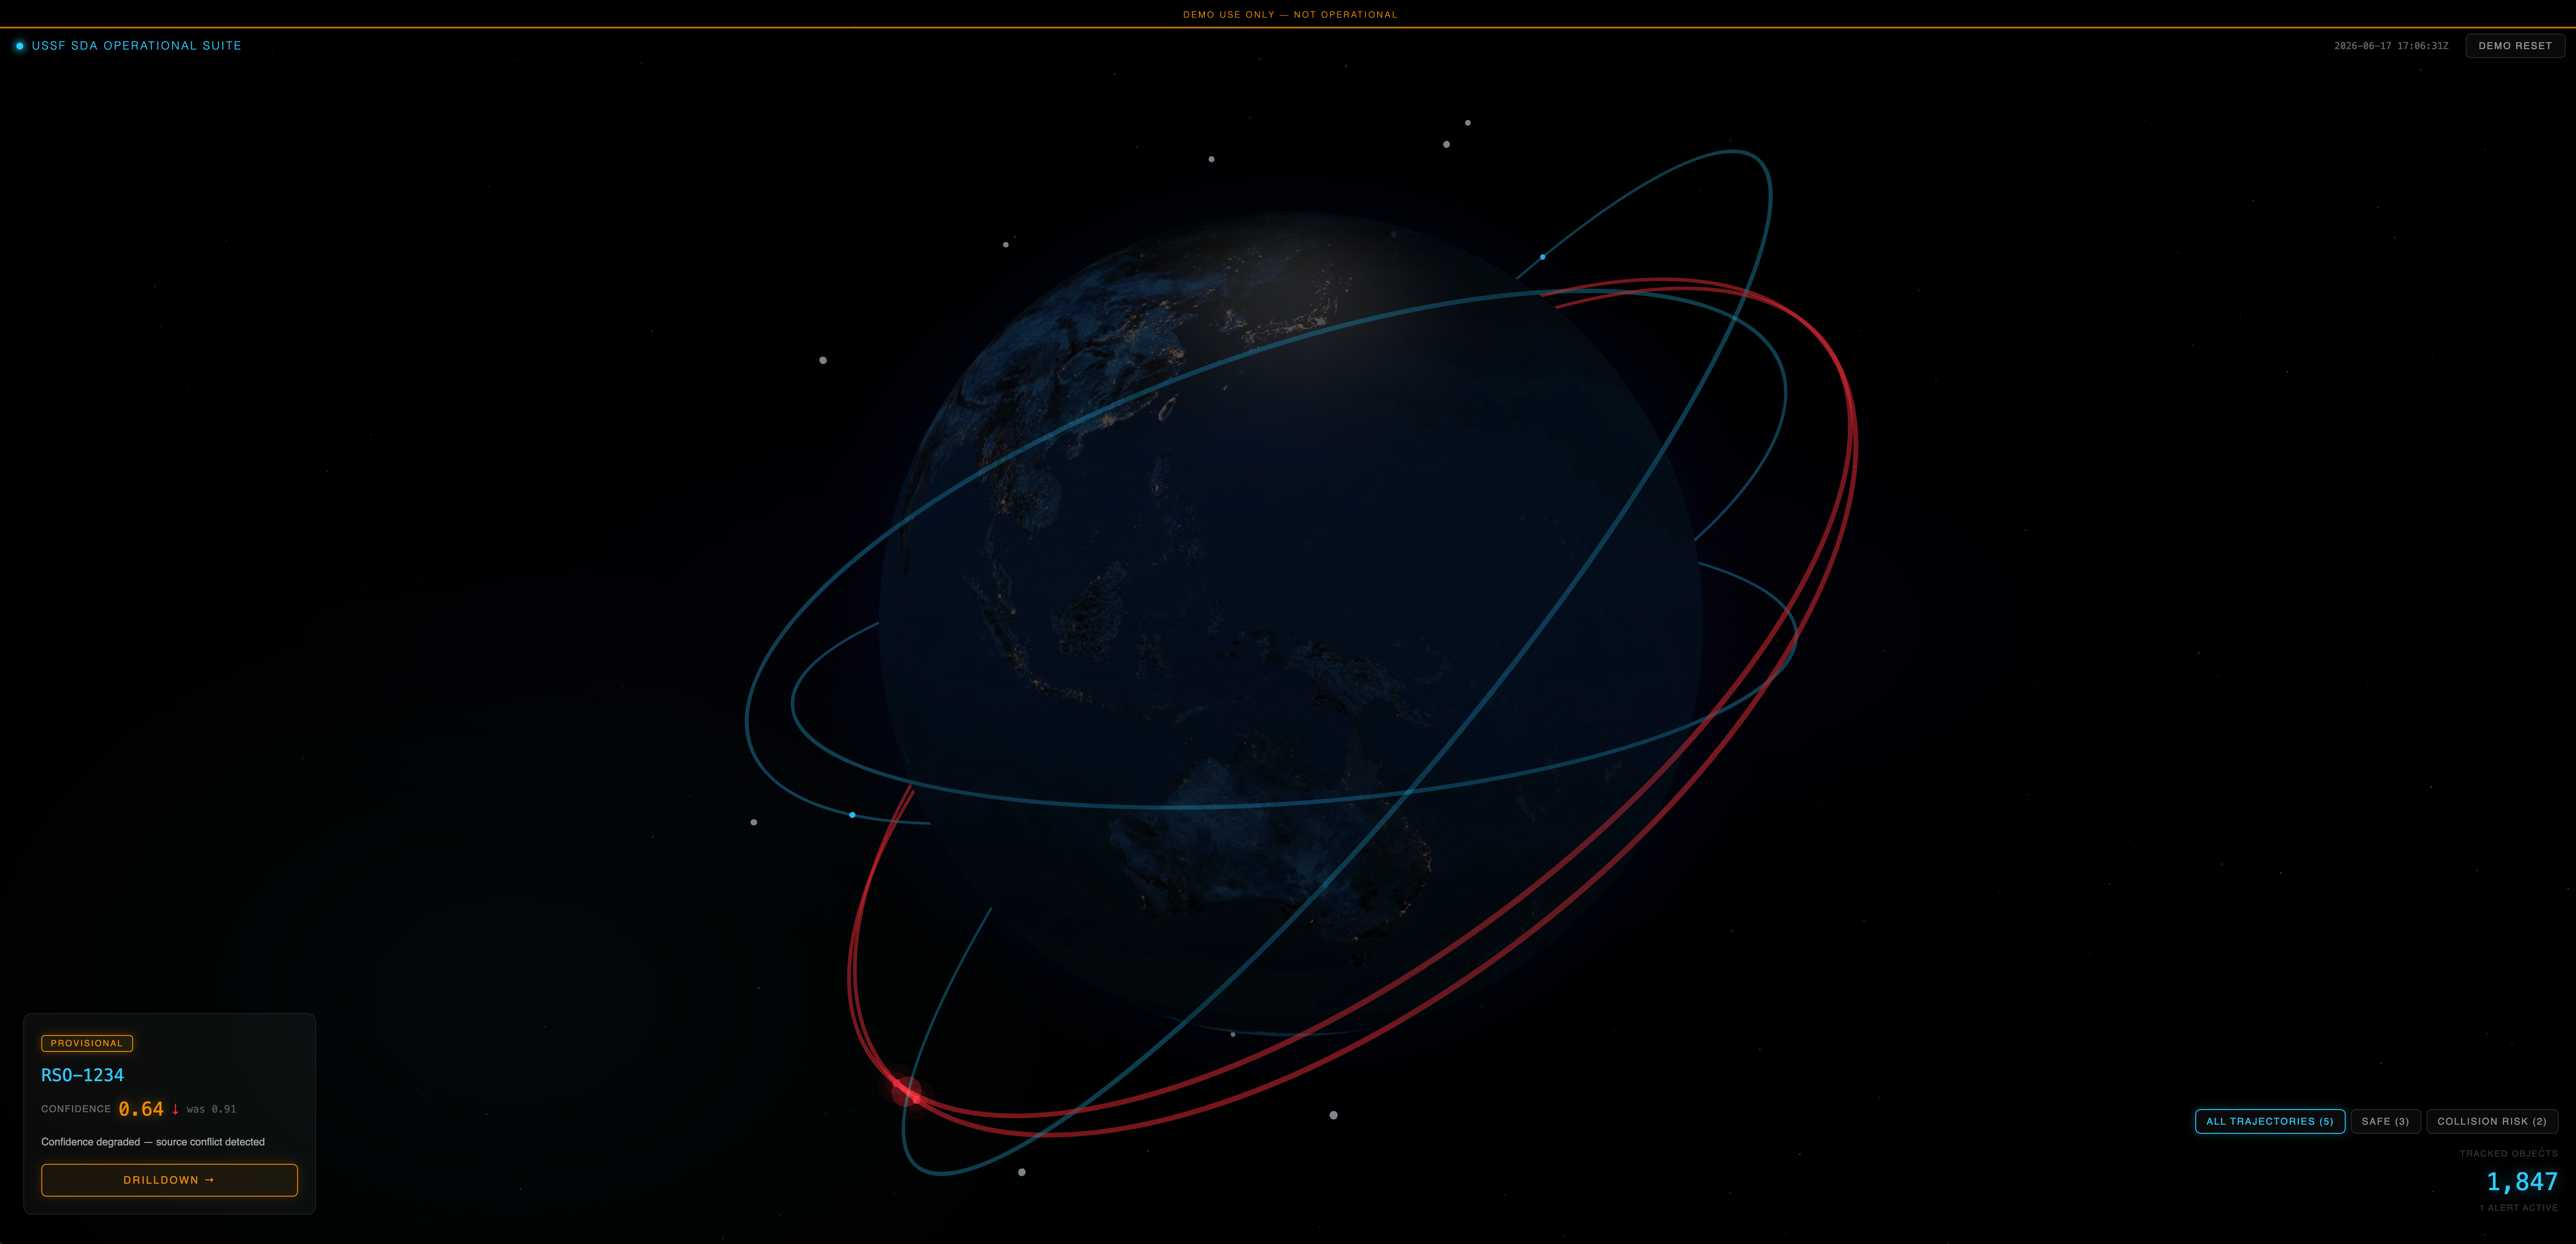
- Globe-first layout. The 3D orbital visualization isn't decorative — it's the primary navigation surface. Selecting an object on the globe populates the data panels. This made the demo immediately legible to anyone in the room, regardless of domain expertise.
- Dark, high-contrast UI. Space operations happen in control rooms. The visual language needed to feel native to that environment — not a SaaS dashboard retrofitted for the domain.
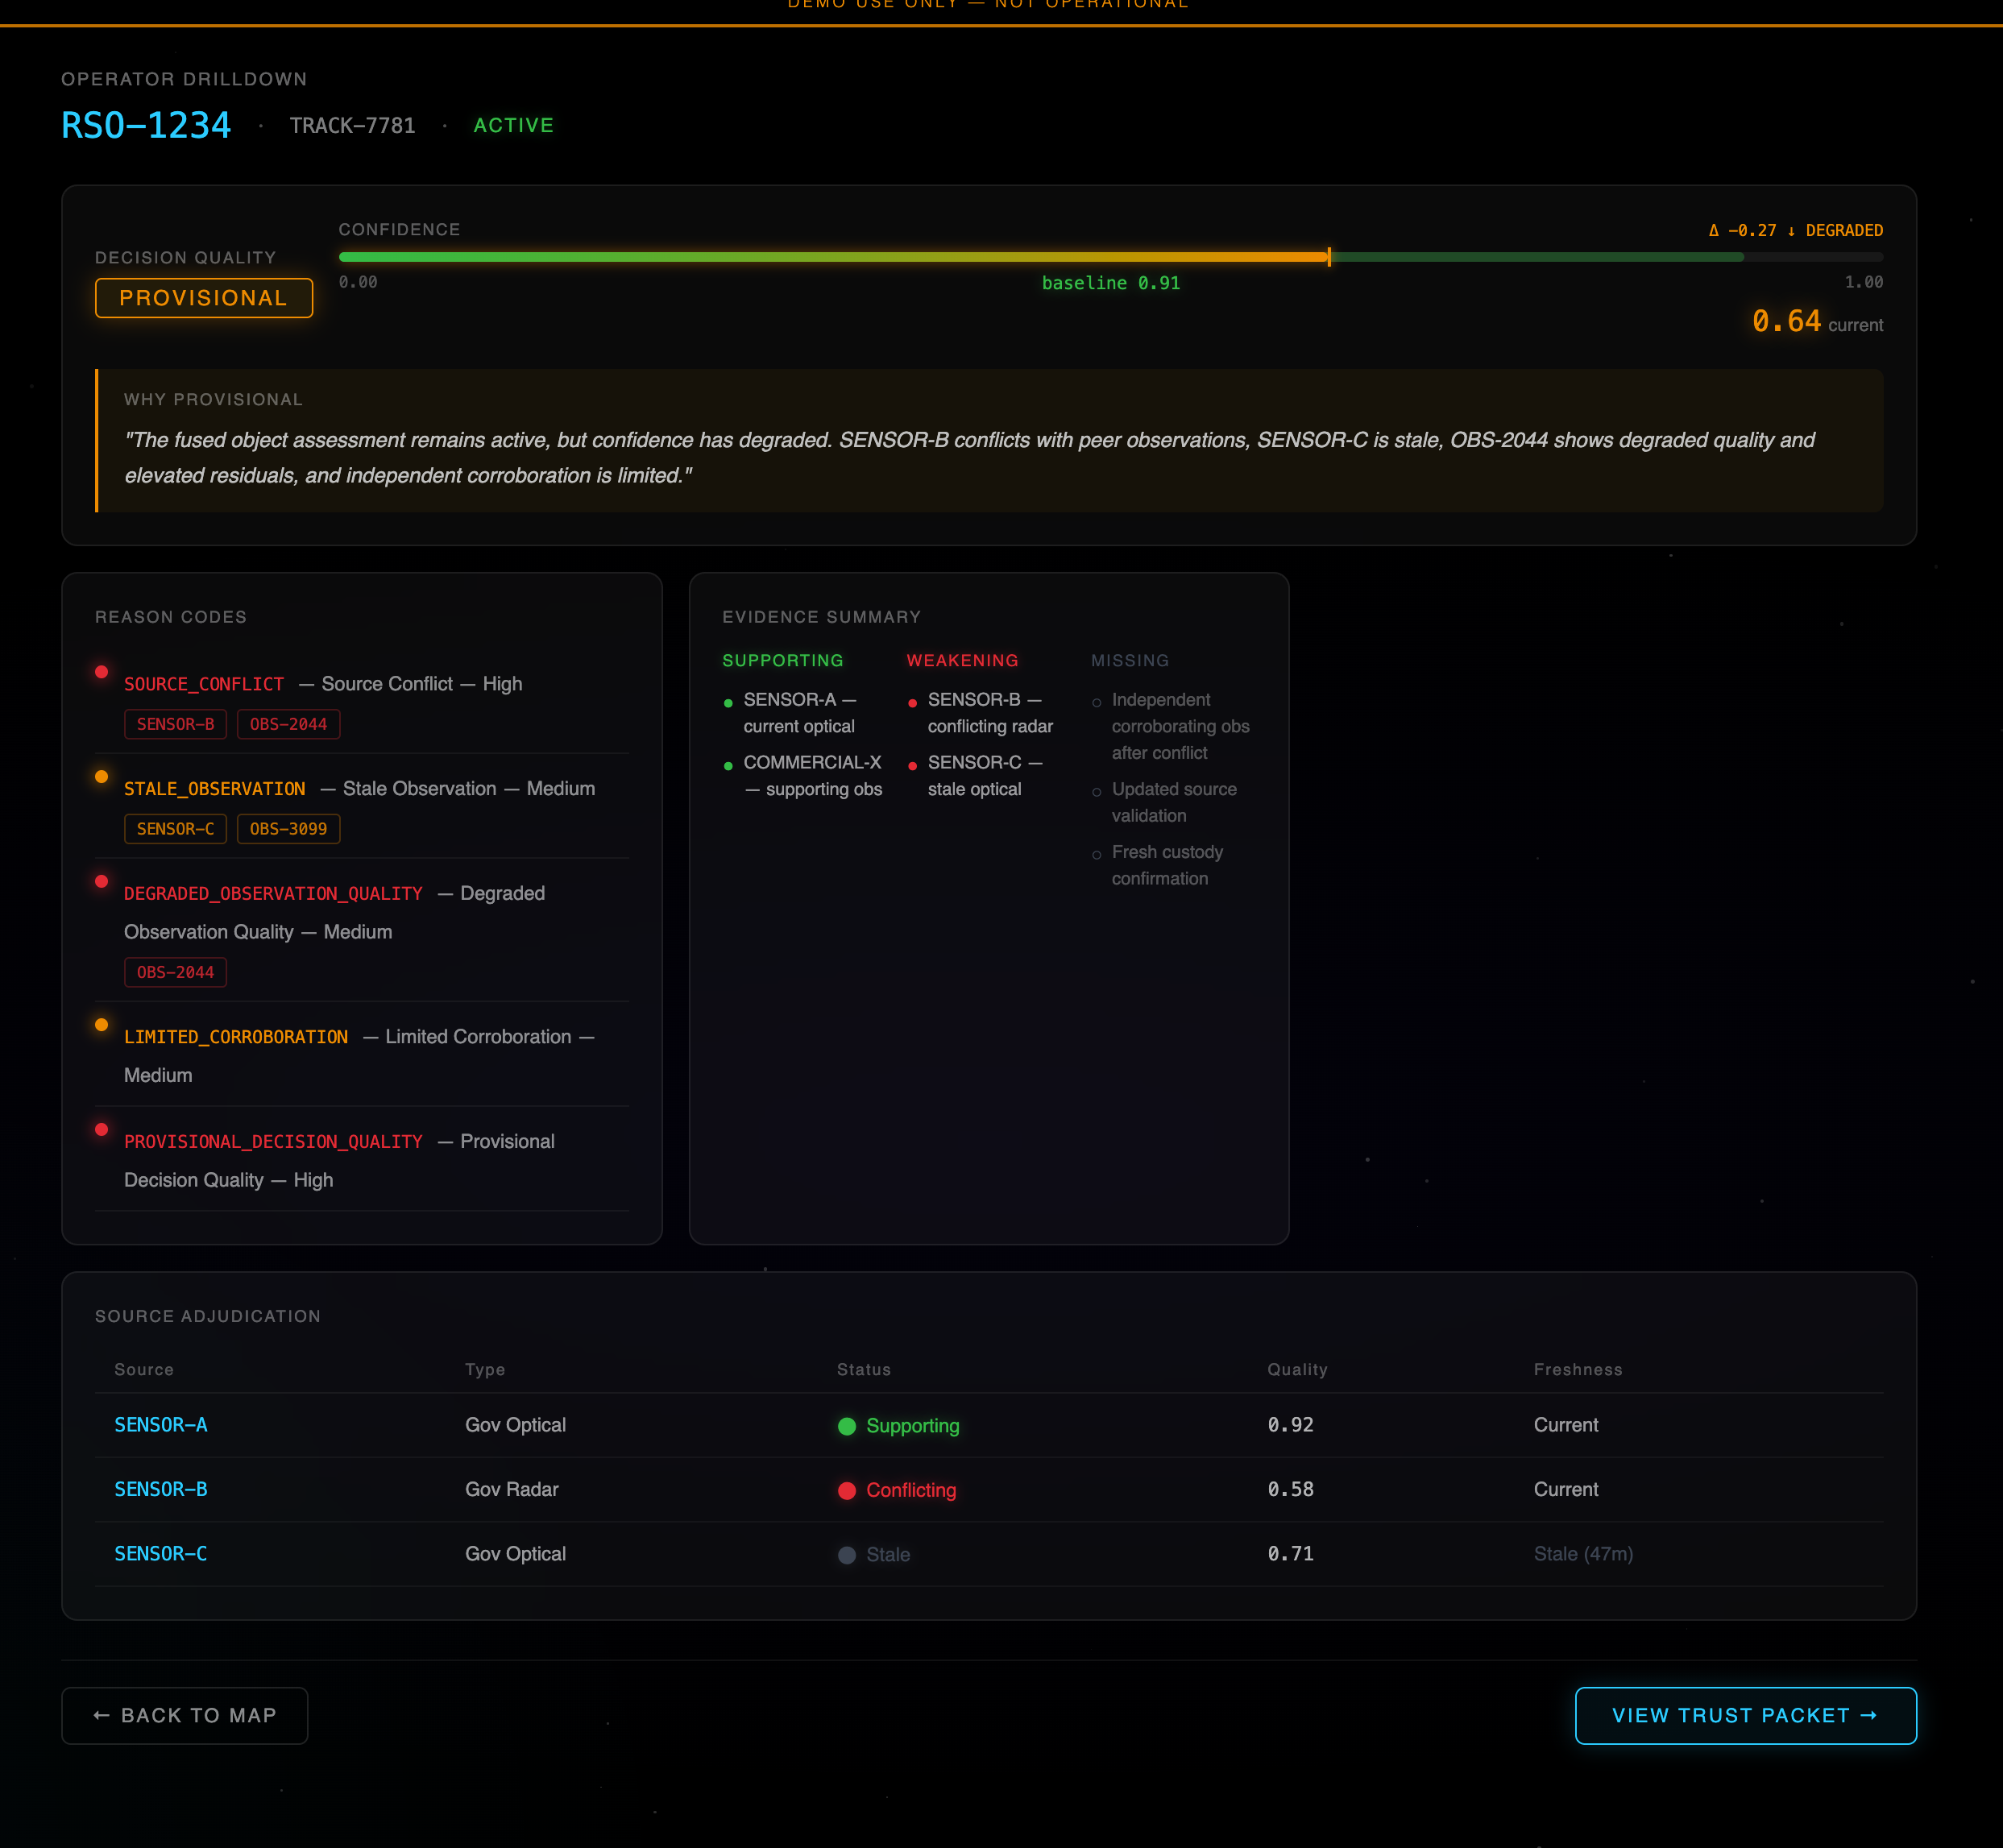
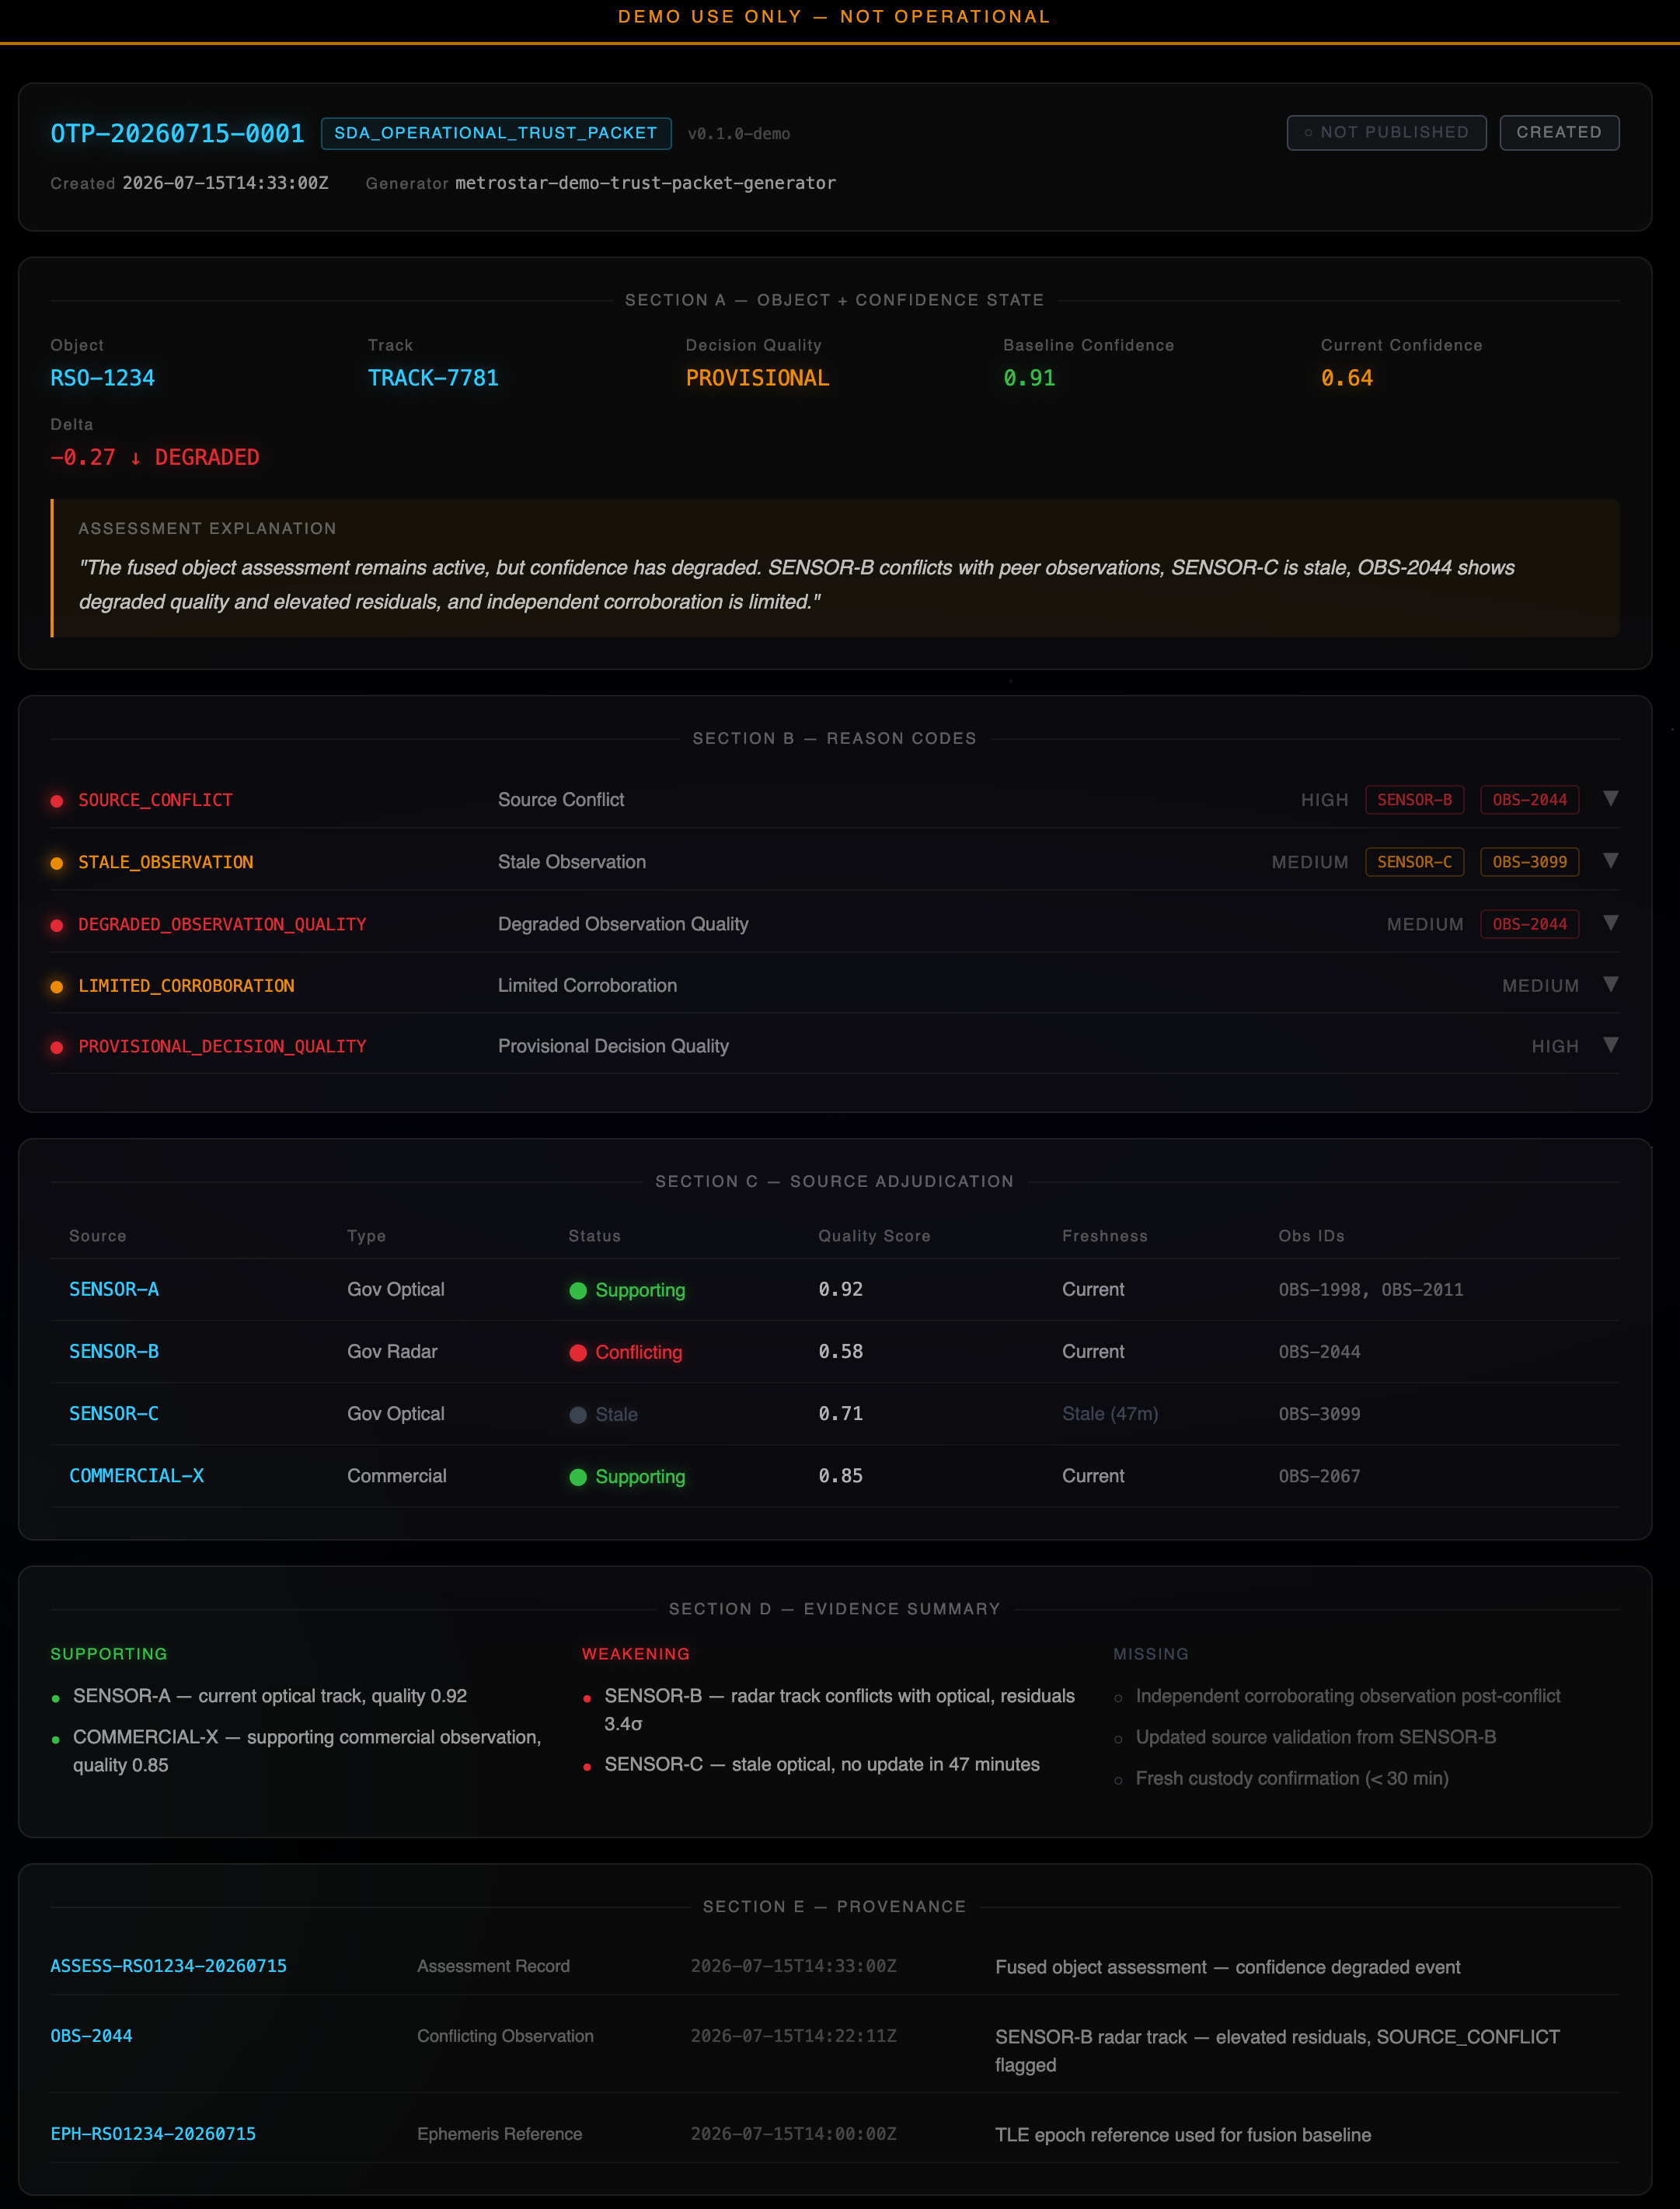
- Scoped to three views. Orbital data, conjunction risk workflows, and mission planning. Enough to tell the full story of the platform's capabilities without scope creep that would have killed the timeline.
From Prototype to Product
The design and build happened in parallel. I prototyped the core layouts and interaction patterns in Figma Make, iterating until the interface felt right — then moved directly into code, using the prototype as a living spec rather than a static handoff document.
The 3D globe was built using Three.js with a WebGL rendering pipeline, with real orbital data driving the satellite positions. Getting the globe to feel responsive and visually clean — not like a generic library demo — required careful work on lighting, material properties, and interaction states.
The entire build — from brief to a deployed, shareable URL — was completed in days, not weeks. AI-assisted workflows across research, prototyping, and development made this timeline possible without cutting corners on quality.
Outcome
The demo was deployed to Vercel and shared with the client as a live, interactive URL — not a PDF, not a Figma link. They could open it, explore it, and share it internally.
It served its purpose: establishing a credible visual and functional baseline for the discovery conversations that followed. The client had something tangible to react to, which compressed the feedback loop and moved the project forward faster than a traditional presentation-deck approach would have.